
It's a nice Monday morning and I come into work all fresh ready for the week ahead. First thing is to check the status of all our various systems... Oh dear, that doesn't look right.. :-(
Here we have a number of Redis instances that we use for various services; mainly to speed up data access for our end users. Some of these are clustered, and some are single instances.
- Redis achieves clustering by splitting data into SLOTS (essentially a checksum is taken from the key to produce a number between 0-16383 - the slot - and the slot number determines which node the data is stored in. You can gain further control of slot number by using braces within a key and then only the data in the braces is used to determine the slot number)
I've set up monitoring for our Redis clusters so I can see usage (iOPS) and memory and a normal cluster should look something like this:
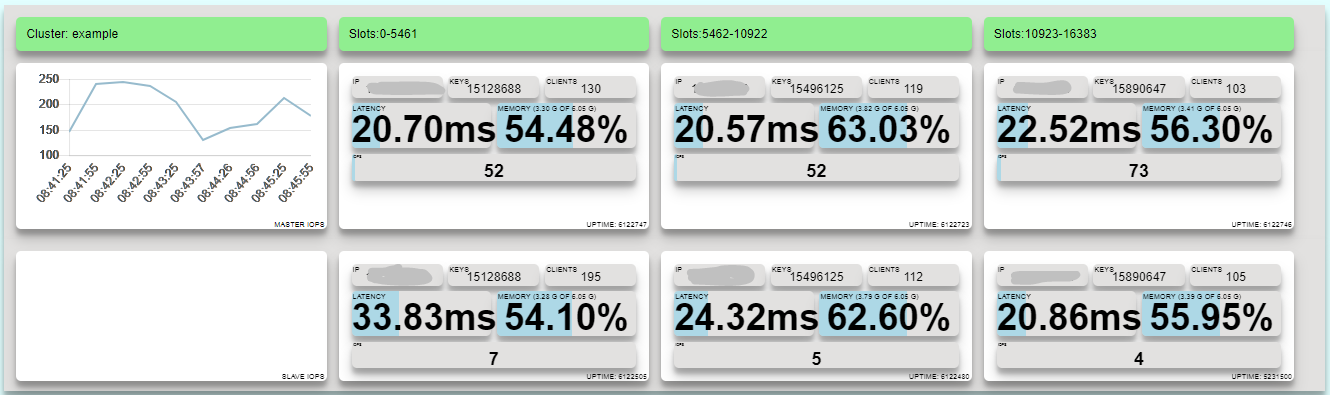
Here we can see a cluster made up of 6 nodes - 3 slot partitioned each mirrored once. Slot numbers 0-5461 are in the left most nodes, 5462-10922 in the middle and 10923-16383 at the end. There are a number of clients connected to each cluster and latency is about 20ms which is a little slow but not enough to cause concern.
Memory usage is between 54.10% and 63.03% depending on the node. Ideally I would like an even spread of memory between each cluster but as some of the data is customer specific we end up in a situation where we have more data in the middle slots.
However on this morning the nodes for slots 0-5461 were showing at 94.5% The other slots were fine.
(Well maybe a little bit, but silently to myself)
Ok, I know that the data usage was ok on Friday, a quick look through our logs show it increased sometime Saturday morning but levelled out at 94% after then and just slowly increased after that. So unless something strange happens again I should have a little while to sort this out.
- By convention we store all our data in Redis with keys in a format prefix:data where prefix determines the type of data. E.g. C is customer data, N is notes. This data is mainly replicated from our source SQL databases.
- We have routines to clear out data from clusters that does not match one of these keys. They are designed to run during production hours. A quick check shows the routine ran successfully at 1am, so I would gain nothing by running it again.
There must be a large amount of data in our cluster that suddenly appeared over the weekend. As this data is mainly replicated from our SQL Servers database I run a quick query to determine the table sizes and compare with a couple of weeks ago. No tables have significantly grown.
Ok, what else could it be?
- When we take the data from SQL we transform it before it goes into Redis, sometimes adding keys to sets to function as a simple index and also adding data to lists to act as queues for various actions that should be performed.
I need to identify which key or keys are taking up so much space. Now, if I was using a local version of Redis I could iterate through the keys and run DEBUG OBJECT on each one to get the serialized length. But these Redis clusters are in AWS and the DEBUG commands are not available on them.
A quick look at Google and I think maybe I can use redis-sampler (https://github.com/antirez/redis-sampler) to work out where my keys are. However it does not report the key names so I'd have to modify it before it would work for me. Maybe another day...
https://github.com/sripathikrishnan/redis-rdb-tools also looks interesting as it will analyses rdb files. However I'm not sure of the time it will take me to transmit 6GB of rdb file to my local machine so I'd like to work on the main system.
Node space is still at 94.5%...
I need to see which keys are taking up the most space on my Redis node. If it was a file system I would use WinDirStat(https://windirstat.net/) to visualise the files.
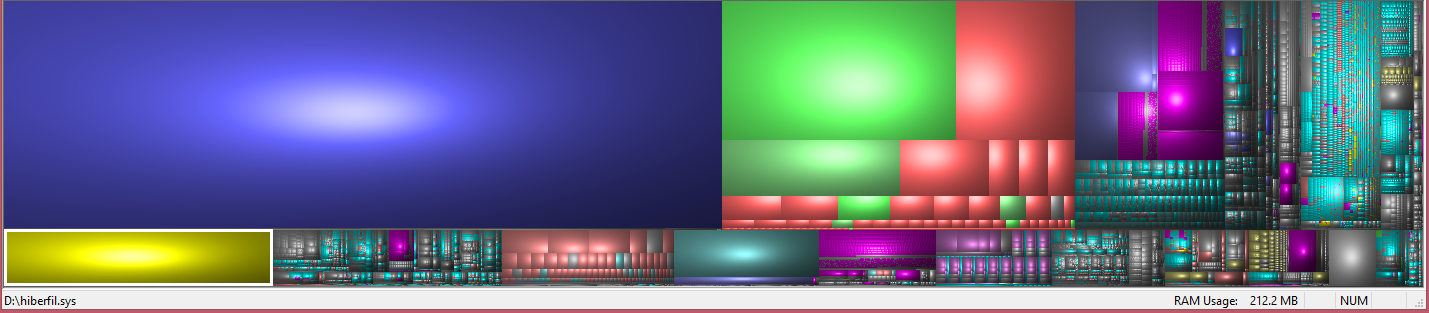
- I really like this visualisation because you can immediately see which files take up too much space. The blue file is a database backup here.
What I need is one of these for Redis.
So how do I make one; first I need a list of all the keys and the size they take up. However there are some 15 million keys in the node so I will need some way of grouping them.
But first to work out how to determine the size of the keys without the DEBUG OBJECT command. In this cluster we have items of type keys, hashmaps, sets and lists. Keys, Hashmaps and Sets are easy because I can GET, HGETALL and SMEMBERS each of these and then look at the length of the response. Whilst this will not be exactly how much it takes up in Redis it should do for what I need as I'll soon be able to see large items. Lists are going to be trickier. I could get each member of the list or just look at the length of them. For now I'll use LLEN to get the length of the list and see what that gives me.
So it's time to start a new project. Fortunately we have a lot of simple libaries that we can use to interface with Redis. So I start a new node project and add my helper classes.
Now what do I need to do? I need to go through each key in the node, determine the type and work out the length. So I'll create a function to scan through the keys and store each key in an array so I can then work out the length. Redis scan is an iterative function which returns the a set of keys and a cursor which holds the state of the previous scan or zero if there are no more items to return. To get the next chunk of data we just call it with the previous cursor value.
    this.scanKeys = function () {

        if (self.cursor == 0) {
            self.finishedScanning();
        }

        if (self.cursor == -1) {
            self.cursor = "0";
        }
        logger.trace("Scanning from cursor", self.cursor);
        self.workingNode.scan(self.cursor, "MATCH", self.wildCard, "COUNT", "10000", function (err, data) {
            if (err) {
                logger.trace(self.redisClusterClient.name + ": Error scanning", err);
            }
            self.cursor = data[0];
            for (var i = 0; i < data[1].length; i++) {
                self.keysToCheck.push(data[1][i]);
            };
            self.totalScanned = self.totalScanned + data[1].length;
            logger.trace("Got a total of " + self.totalScanned + " keys");

            if ((self.cursor != "0") && self.totalScanned < 50000) {
                self.iteration++;
                self.scanKeys();
            } else {
                self.finishedScanning();
            }
        });
    }
So this function runs recursively and builds up a list of keys to check in an array (self.keysToCheck). Once we have finished scanning the entire cluster (the cursor returned is zero) and we call self.finishedScanning().
This is going to run on a live cluster so I do not want to scan more than 10000 keys at a time because I don't want to slow down the node. Whilst this is running I will keep an eye on the iOPs in the cluster and the latency times.
Time to run the first iteration of the code which will just scan the keys. After fixing a couple of silly bugs it's running but is quite slow (it's running from my machine and I expect network latency is to blame), the iOPs on the cluster are not very high.
Now to add routines for determining the size of each key. First I need to use the TYPE command on each key and then depending on that type I use another command.
        this.getLength = function (pos) {
            var command = "";
            if (pos == undefined) {
                pos = 0;
            }


            var command = 'GET';
            var outputLength = false;
            if (self.types[pos] == 'list') {
                command = 'LLEN';
                outputLength = true;
            } else if (self.types[pos] == 'set') {
                command = 'SMEMBERS'
            } else if (self.types[pos] == 'hash') {
                command = 'HGETALL'
            } else if (self.types[pos] == 'zset') {
                command = 'ZCARD';
                outputLength = true;
            }
            self.workingNode[command](self.keysToCheck[pos], function (err, data) {
                if (pos % 100 == 0) {
                    logger.trace("Getting length ", pos)
                }
                if (outputLength) {
                    self.sizes.push(data)
                } else {
                    self.sizes.push(JSON.stringify(data).length)
                }
                if (pos < self.keysToCheck.length - 1) {
                    self.getLength(pos + 1);
                } else {
                    self.finishedGettingLengths();
                }
            });
        }
A bit more debugging and this is running fine. After each 50000 keys I write the output to a file so I can keep an eye for large keys.
I've got about 200,000 keys but it's really slow and none of them look very large yet. A quick calculation tells me its going to take 3 days to scan the entire node. Not good.
I've got a couple of options now. The main time is taken up in the getType and getLength functions. I think about putting them in a MULTI block but because the node is part of a cluster the TYPE function complains that the keys are from different slots. So I can either split my code into two projects, running one that gets the keys and multiple instances of another one which determines types and lengths. This is probably a good idea for the future, but I'm concerned how much time it will take to engineer. I'll call it plan B.
Plan A is to run the code on a machine in AWS to reduce network latency. I copy the project over and change a couple of paths. After starting it up I can see it's going to take just over an hour to run. Memory usage is still ok so I'll go for this option.
The routine is generating files which contain a list of keys, their type and length.
"C:A:{12345}:12929","set","10"
    "N:123","hash","199"
    "C:B:{12345}:19555","set","9"
    "D:1000","string","9"
I'd like to visualize them but first really I just want to see if any are large.
keysize.sh

    cat map*.csv | sed 's/\"//g' | sort -k3nr -t","
I watch -n60 this in a seperate window so I can see if any large keys pop up.
Cluster is now running at about 3000 iOPs which is higher than average, but way below any alert threshold so I'm fine.
The routine is running fine, a couple of large(ish) keys have appeared (14mb or so) but not in the gigabyte range I am looking for.
I've got a script that will show me large keys so that should tell me when I find it, but I'd still like to be able to visualize the data nicely.
Time to ask Uncle Google again. It seems what I am looking for is a "treemap" and I find a nice example using D3 at http://bost.ocks.org/mike/treemap/.
This will probably work for me, although with 15 million keys I'm going to need to aggregate my data somehow. As mentioned above we store our data in a key with the format KEY:DATA, however in most cases its KEY:SUBKEY:DATA or KEY:SUBKEY:DATA:DATA, typically the key and subkey are fixed and the data can be things like customer number or an identity field. So I'd like to aggregate by each section in this key. But where we have numbers I'll just replace those with 'number' or something so I don't end up with millions of entries. If I need to change this I will.
I end up finding a nice example here: http://bl.ocks.org/ganeshv/6a8e9ada3ab7f2d88022 which I decide to use.
I need to provide the data in a JSON string of key/value pairs with a values array for sub items.
        {
            "key": "Keys",
            "values": [{
                "key": "A",
                "values": [{
                    "key": "A:A",
                    "values": [{
                        "key": "A:A",
                        "value": 518,
                        "count": 1
                    }]
                }, {
                    "key": "A:B",
                    "values": [{
                        "key": "A:B:Number",
                        "value": 3592278,
                        "count": 143036
                    }]
                }, {
                    "key": "A:Number",
                    "value": 2916300,
                    "count": 341919
                }, {
                    "key": "A:REP",
                    "values": [{
                        "key": "A:REP:MODE",
                        "value": 6,
                        "count": 1
                    }]
                }]
                .
                .
                .
            }]
        }
So I start to write a quick (and dirty routine) to read a file containing all the keys and map it to this structure.
Usage 94.6%, iOPs still at 3000 or so.
I'm testing the data mapping and tweaking the layout slightly. There's not a lot more I can do until I find the large key (or keys). I've got my watch window open...
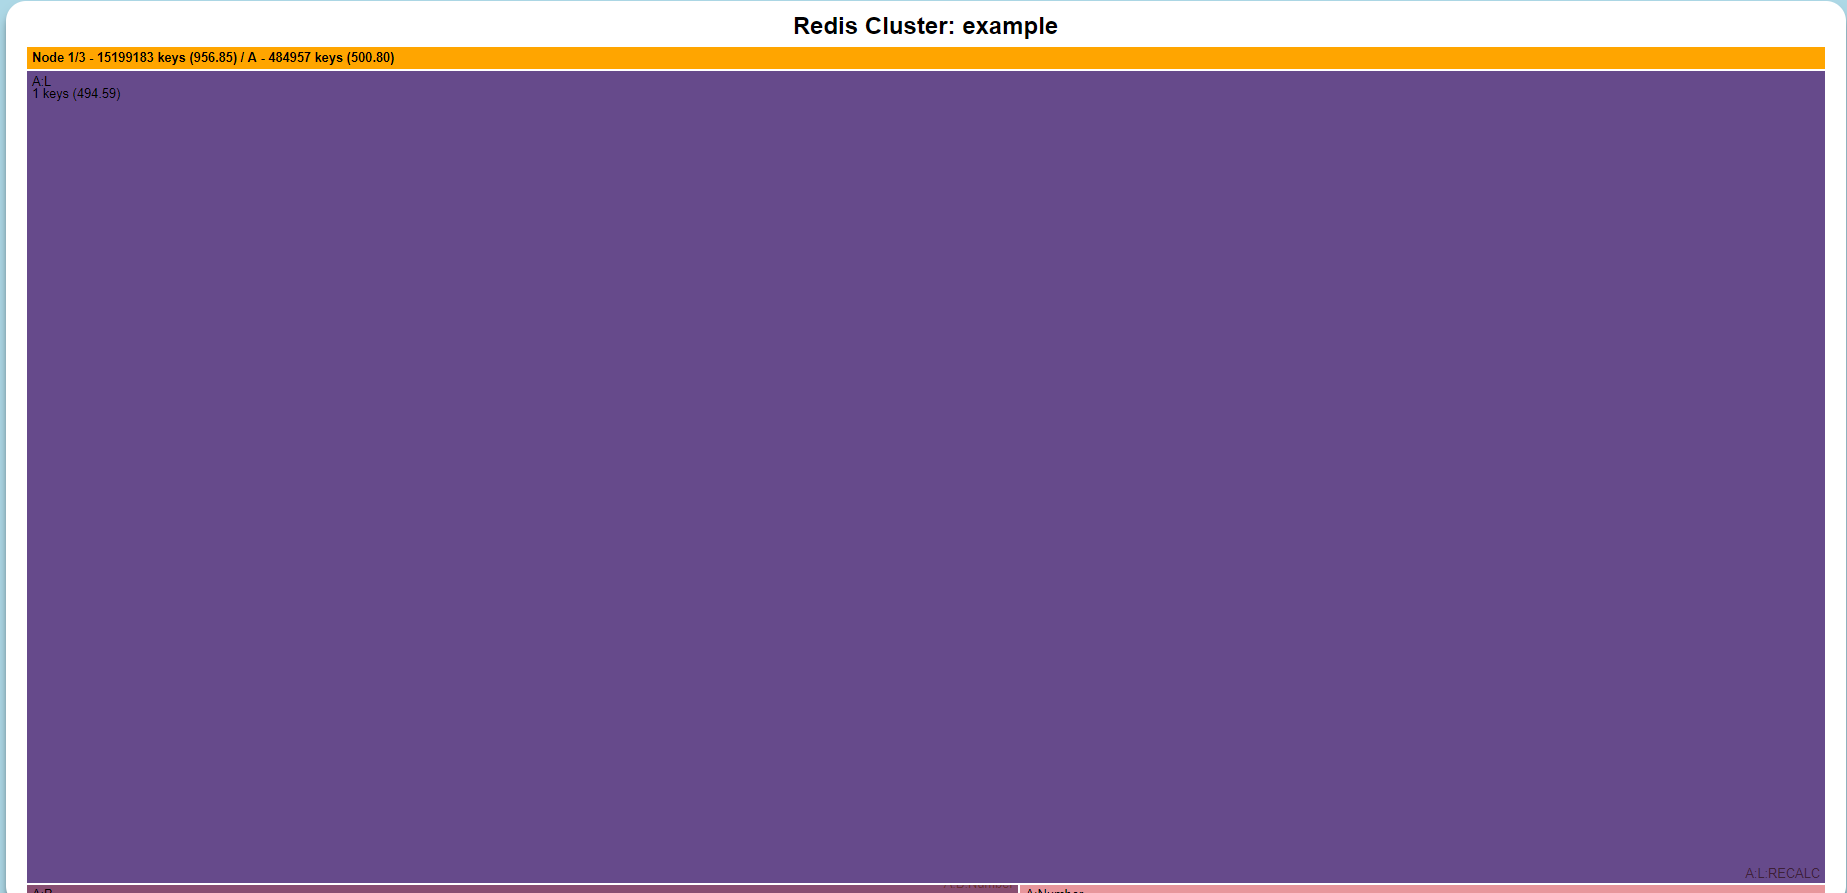
Key A:L:RECALC appears at the top of my list with a size of 518,615,266!
This is a list (that's what the L means for us) of items that need to be recalculated. There are half a billion items in it. So the size of this list must be huge. This is the key that is causing problems.
We use lists here mainly to schedule work agents. It seems that this list gets items pushed into it when certain keys in the SQL database are deleted and recreated. Then an agent is supposed to pick up these keys and recalculate certain statistics based on them. However - things have changed - and the agent is no longer needed, and is not running. The statistics are now calculated on the fly.
On Saturday morning a database job ran which quickly deleted and recreated a lot of records a large (518m) number of times.. our routines synced these changes to Redis and pushed on the queue (which is supposed to be obsolete). Because it's obsolete nothing was explicitly monitoring the queue length and the items just sat there.
I delete the queue and remove the code that pushes to it.
Usage 54.56%
Panic over, no ones noticed and our node is healthy again. Sometime before 12 the entire key scanning finished so I run my routine to produce the JSON map that the treemap project needs. Even though I've already deleted the key I want to know if this situation happens in the future that these routines work.
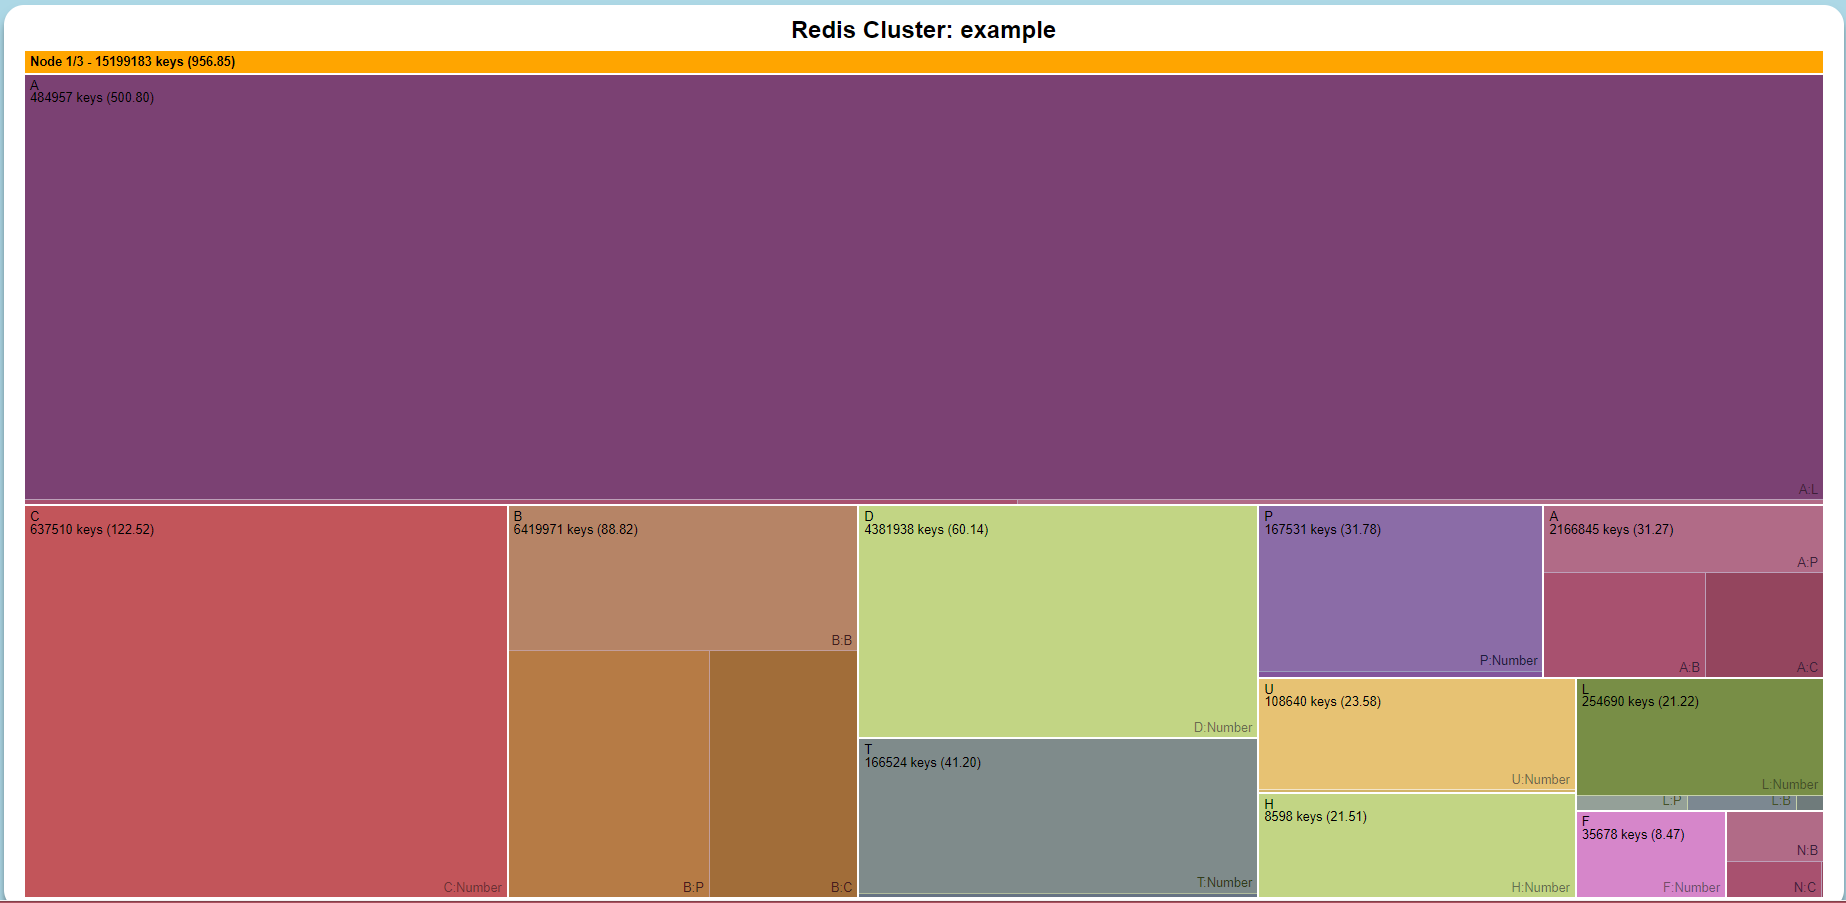
In here it's immediately obvious that the A keys are taking up the most space, zooming in (by clicking) shows the A:L:RECALC key as being the culprit.
Whilst the sizes aren't an accurate to the byte level the map has helped me find the culprit, and in the future will be a useful tool. What I need to do now is join everything together as there are a number of steps involving copying files and running scripts - and this is the last thing you want to do when something is broken. Also other people need to be able to run this.
I plan to rework the code into two microservices, one to get the keys the other to work out sizes. Then the size one can be scaled on demand, and use different strategys based if the node is part of AWS or part of a cluster or not. I also need to tidy the mapping function.
But I can breath a sigh of relief and get back to the day job. The problem has been solved. We need to have an analysis of our procedures to determine why the queue got removed from monitoring but there was a service that still wrote to it but that will wait until after lunch!